This is a search tool backed by a synthetically generated database covering a number of high-entropy alloy (HEA) systems containing up to 5 elements chosen among Al, Cr, Cu, Fe, Mn, Mo, Ni, and Si. The database was generated within the CoBRAIN project through neural network-based machine learning models trained onto high-throughput physical modelling results – CalPhaD and Density Functional Theory (DFT) methods; experimental results – pin-on-disc sliding wear and electrochemical corrosion tests; and existing literature databases (hardness, pitting potential) augmented by experimental results.
This is the publicly available version of a Sustainable Decisions Support System (SDSS) in development within the CoBRAIN project. The full version, not yet available for public release outside the project, also contains a Life Cycle Performance Assessment (LCPA) tool to assess the environmental, health & safety, and economic sustainability of each solution.
This search tool generates 2D plots showing how various HEA systems are positioned with respect to the balance among two properties chosen among Vickers hardness, pitting potential, stacking fault energy, specific wear rate under sliding conditions, and density. The user can restrict the search to a specific 5-element system or span the entire database; restrictions can be put on the minimum and maximum concentration of each element, and on the main crystalline phase of each alloy, including solid Body-Centred Cubic (BCC) and Face-Centred Cubic (FCC) solid solutions, as well as various possible intermetallics.
For each of the plotted alloys, the user can visualise the properties and generate a “synthetic data sheet” of the material.
Users are welcome to employ the tool for their research and development purposes and provide feedback via email to info@cobrain-project.eu
INPUT
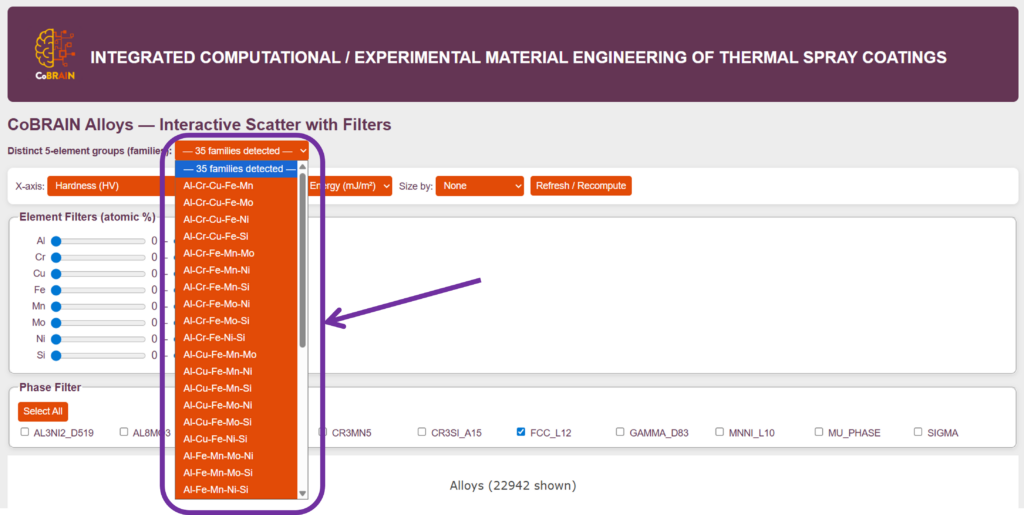
Select a specific 5-element HEA family or leave “35 families detected” to search on the entire database
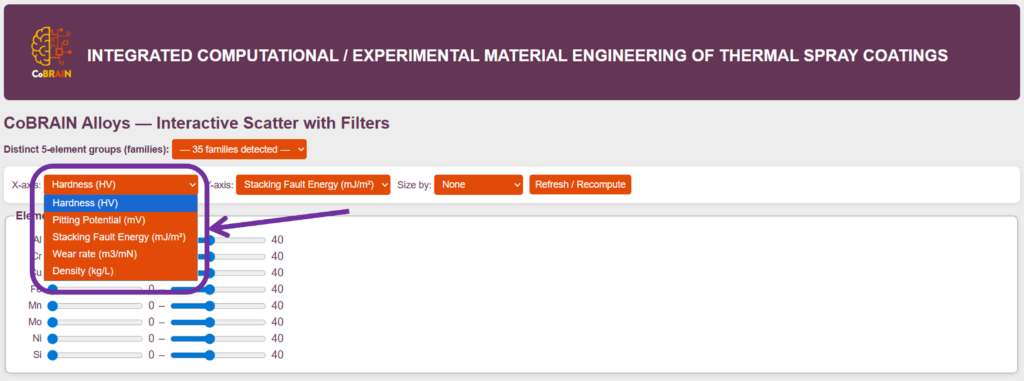
Select the two properties to be plotted on the x- and y-axes. Choose among: Hardness (HV) = Vickers hardness of the material Pitting potential (mV) = potential for the onset of pitting measured by potentiodynamic polarization in an aerated 3.5% NaCl aqueous solution at room temperature Stacking Fault Energy (mJ/m2) – energy expenditure for the generation of stacking faults. Negative values indicate that the material is prone to twinning or strain-induced phase transformation Wear rate [m3/(N˙m)] = specific wear rate measured by ball-on-disc sliding wear tests at room temperature Density (kg/L)
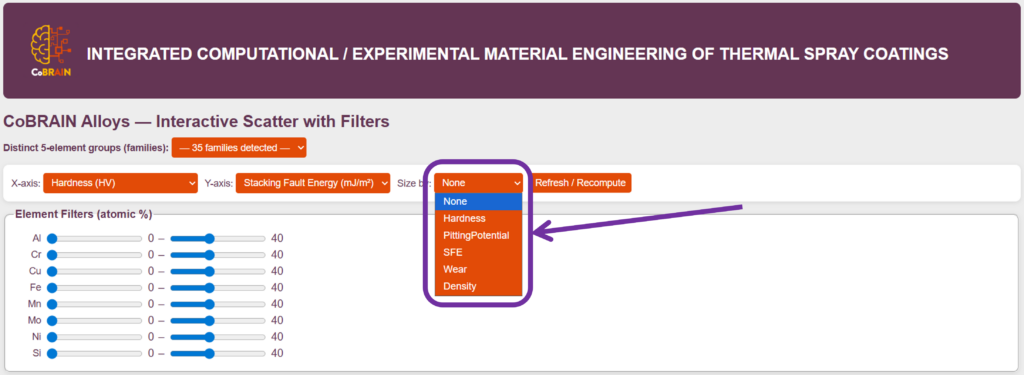
Choose whether the dots showing each alloy on the plot should have their size scaled proportionally to the value of any of the selectable properties (“Size by”)
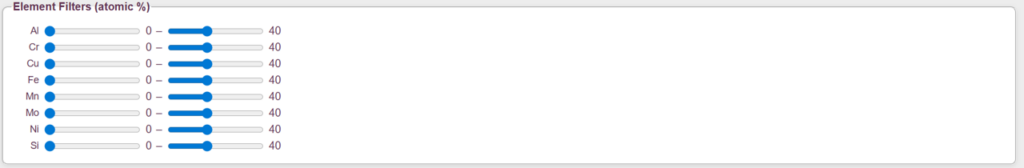
Set the compositional limits (min and max) for each element. Note: the concentration of each element can be changed in steps of 5%. The tool does not enforce an automatic closure to 100%, so the user must make sure that the sum of the maximum amounts of all selected elements is not lower than 100%, otherwise the tool will not show any alloy.
Set which should be the main phase(s) of the alloy by flagging / unflagging each of the possible phases.
OUTPUT
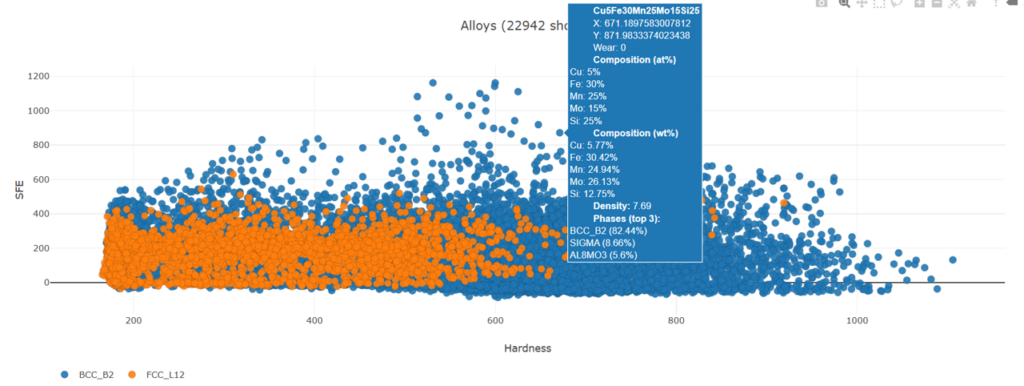
Each dot in the plot represents an alloy.
You can click on any of the dots in the plot to visualize the composition (in atom.% and mass%), the exact x- and y-coordinates in the plot, the density, and the three main phases in a pop-up window.
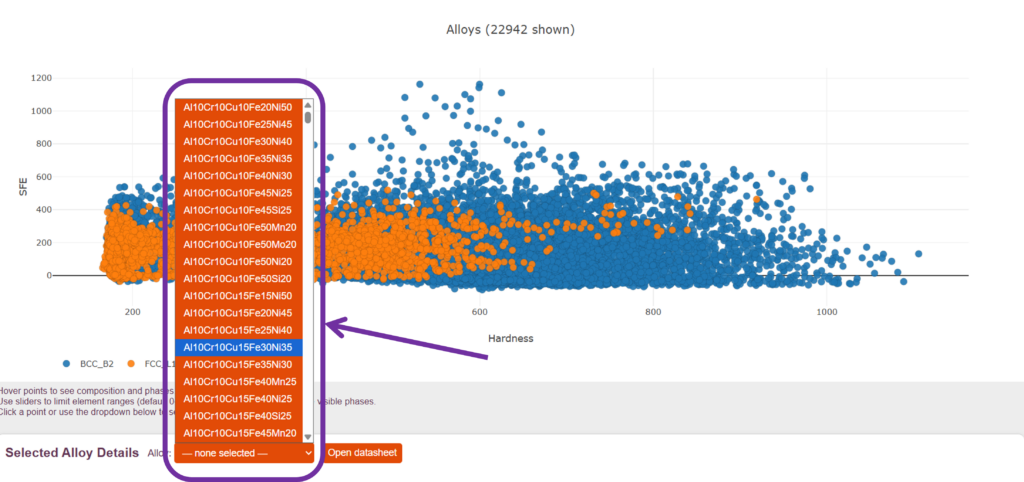
You can also select the specific alloy by clicking on the scroll-down menu on the selection bar.
At the bottom of the page, a summary of the properties of the selected alloy is also shown. Click on “Open datasheet” to generate a synthetic technical data sheet of the chosen material (opens in a new tab).
Click on “Export as PDF” in the new tab to generate a pdf version of the data sheet.
HINTS
Toughness/ductility are not explicitly among the selectable properties. To look for ductile alloys, search for materials with limited hardness and consider that: Alloys which primarily or exclusively consist of solid solution phases are usually more ductile than those that contain predominantly intemetallic phases. An FCC solid solution is usually more ductile than a BCC one.
The SFE indicates the preferred deformation mode of the alloy: SFE > ~20 mJ/m2 indicates a material that likely deforms mainly by dislocation slip. 0 < SFE < ~20 mJ/m2 indicates a material that likely deforms mainly by twinning. ~-20 < SFE < 0 mJ/m2 indicates a material that likely deforms mainly by transformation-mediate twinning. SFE < ~-20 indicates a material that likely exhibits transformation-induced plasticity (TRIP) behaviour.